In Machine Learning, a common task is to generate images for metrics such as the confusion matrix and the classification report, which are useful for evaluating model performance.
Here, I will demonstrate how to generate and save these metrics as images using Python’s scikit-learn, matplotlib and seaborn.
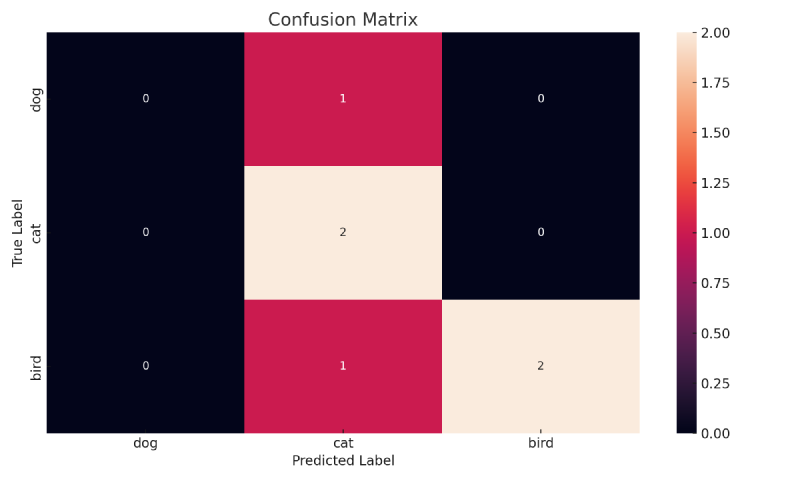
Confusion matrix #
First, here’s the function for the confusion matrix:
import matplotlib.figure
import matplotlib.pyplot as plt
import pandas as pd
import seaborn as sns
from sklearn.metrics import confusion_matrix
def plot_confusion_matrix(y_true: list, y_pred: list, label_list: list, title: str = "Confusion matrix") -> matplotlib.figure.Figure:
conf_mat = confusion_matrix(y_true, y_pred, labels=label_list)
print(conf_mat)
fig, ax = plt.subplots()
sns.heatmap(conf_mat, annot=True, fmt="d", xticklabels=label_list, yticklabels=label_list)
plt.ylabel("True")
plt.xlabel("Pred")
plt.title(title)
plt.tight_layout()
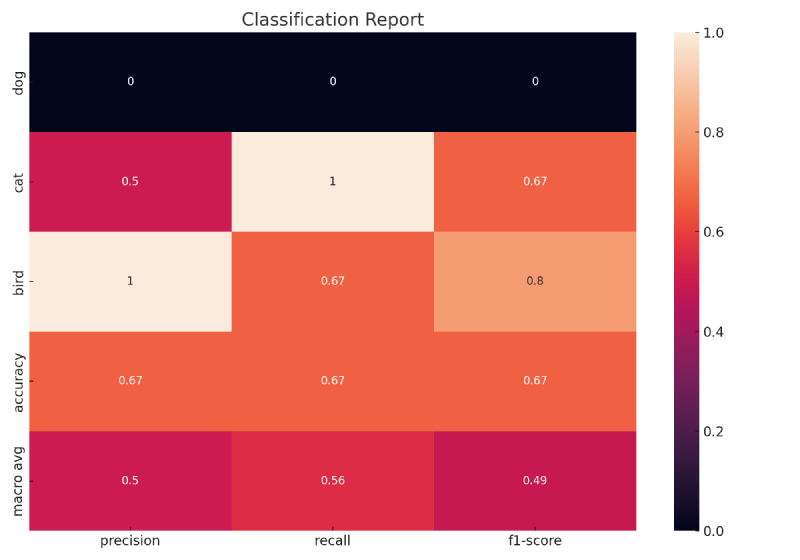
return figClassification report #
And here’s the one for the classification report.
import matplotlib.figure
import matplotlib.pyplot as plt
import pandas as pd
import seaborn as sns
from sklearn.metrics import classification_report


def plot_classification_report(y_true: list, y_pred: list, label_list: list, title: str = "Classification report") -> matplotlib.figure.Figure:
    report = classification_report(y_true, y_pred, labels=label_list, output_dict=True)
    df_report = pd.DataFrame(report).transpose()

    fig, ax = plt.subplots(figsize=(10, 7))
    sns.heatmap(df_report.iloc[:-1, :-1], annot=True)
    plt.title(title)

    plt.tight_layout()

    return fig
Usage #
With these functions, you can now generate and save these figures like this:
y_true = ["cat", "dog", "bird", "cat", "bird", "bird"]
y_pred = ["cat", "cat", "bird", "cat", "cat", "bird"]
label_list = ["dog", "cat", "bird"]

fig1 = plot_confusion_matrix(y_true, y_pred, label_list, title="My Confusion Matrix")
fig2 = plot_classification_report(y_true, y_pred, label_list, title="My Classification Report")
fig1.savefig('confusion_matrix.png')
fig2.savefig('classification_report.png')